

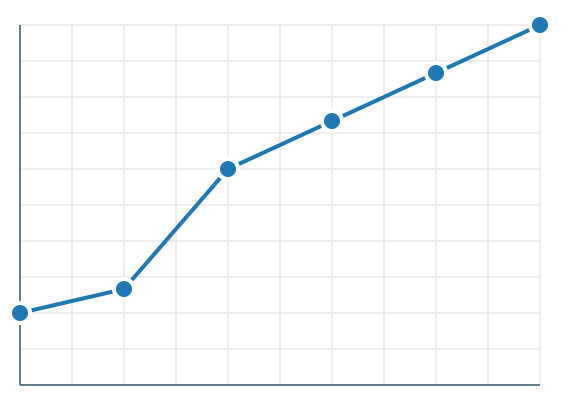
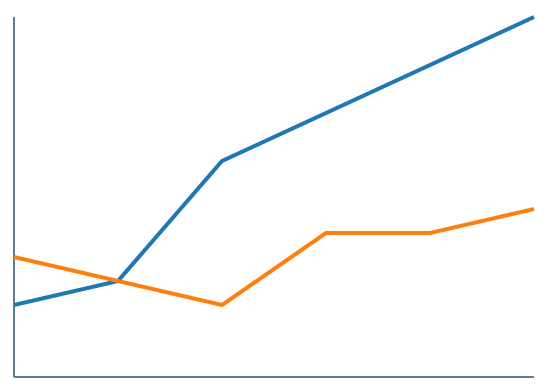
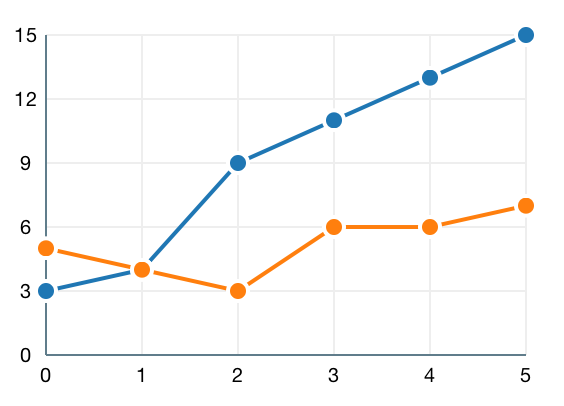
Swift LineChart Usage var lineChart = LineChart () lineChart. addLine ([ 3 , 4 , 9 , 11 , 13 , 15 ]) Features Super simple Highly customizable Auto scaling Touch enabled Area below lines Properties Both x and y properties are of type Coordinate . Each can be customized separately and has its own settings for labels, gridlines and axis. labels : Labels grid : Grid axis : Axis Labels can be switched on and off and they can have custom values. visible : Bool = true values : [String] = [] Grid can also be switched on/off, has a custom color and you can specify how many gridlines youd like to show. visible : Bool = true count : CGFloat = 10 color : UIColor = UIColor(red: 238/255.0, green: 238/255.0, blue: 238/255.0, alpha: 1) // #eeeeee Axis can be switched on/off, has a property to its color and you can specify how much the axis is inset from the border of your UIView. visible : Bool = true color : UIColor = UIColor(red: 96/255.0, green: 125/255.0, blue: 139/255.0, alpha: 1) // 607d8b inset : CGFloat = 15 Animations can be customized through the Animation settings. enabled : Bool = true duration : CFTimeInterval = 1 If youd like to show extra dots at your data points use the Dots features. visible : Bool = true color : UIColor = UIColor.whiteColor() innerRadius : CGFloat = 8 outerRadius : CGFloat = 12 innerRadiusHighlighted : CGFloat = 8 outerRadiusHighlighted : CGFloat = 12 In addition to the above mentioned features you can further customize your chart. area : Bool = true - Fill the area between line and x axis lineWidth : CGFloat = 2 - Set the line width colors : [UIColor] = [...] - Colors for your line charts Methods Add line to chart. lineChart.addLine(data: [CGFloat]) Remove charts, areas and labels but keep axis and grid. lineChart.clear() Make whole UIView white again lineChart.clearAll() Delegates didSelectDataPoint() Touch event happened at or close to data point. func didSelectDataPoint ( x : CGFloat, yValues : [CGFloat]) { println ( " \( x) and \( yValues) " ) } Examples Single line with default settings. var lineChart = LineChart () lineChart. addLine ([ 3 , 4 , 9 , 11 , 13 , 15 ]) Two lines without grid and dots. var lineChart = LineChart () lineChart. area = false lineChart. x . grid . visible = false lineChart. x . labels . visible = false lineChart. y . grid . visible = false lineChart. y . labels . visible = false lineChart. dots . visible = false lineChart. addLine ([ 3 , 4 , 9 , 11 , 13 , 15 ]) lineChart. addLine ([ 5 , 4 , 3 , 6 , 6 , 7 ]) Show x and y axis var lineChart = LineChart () lineChart. area = false lineChart. x . grid . count = 5 lineChart. y . grid . count = 5 lineChart. addLine ([ 3 , 4 , 9 , 11 , 13 , 15 ]) lineChart. addLine ([ 5 , 4 , 3 , 6 , 6 , 7 ]) License MIT
Line Chart library for iOS written in Swift
3997
来源:
Licence:
联系:
分类:
平台:
环境:
大小:
更新:
标签:
免费下载
×


温馨提示
请用电脑打开本网页,即可以免费获取你想要的了。