


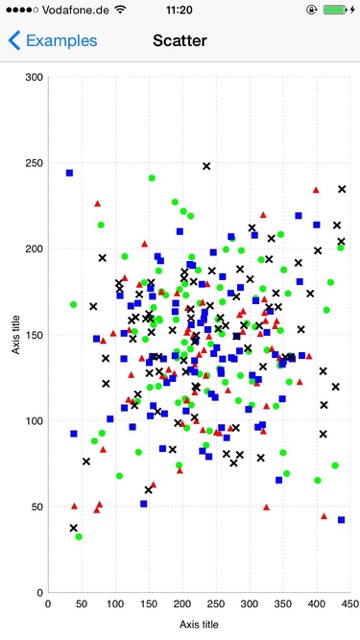
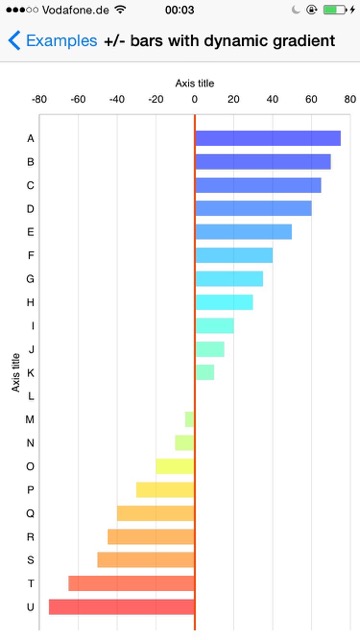
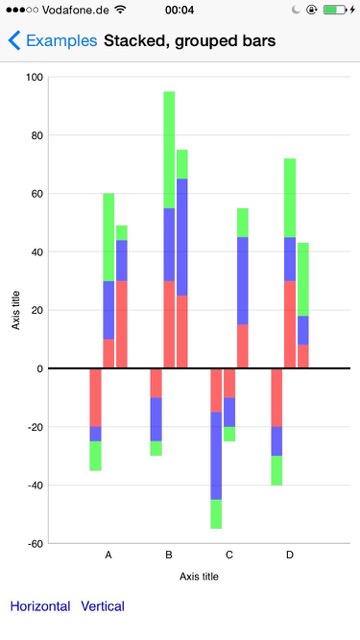
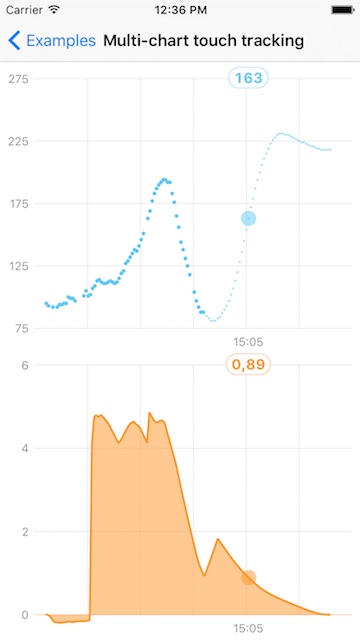
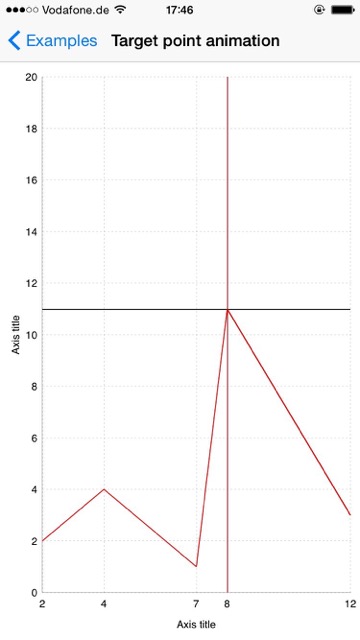
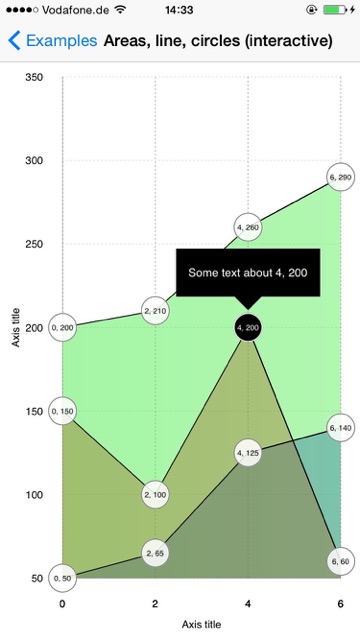
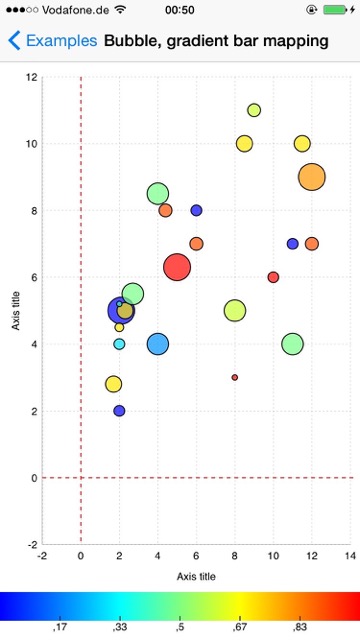
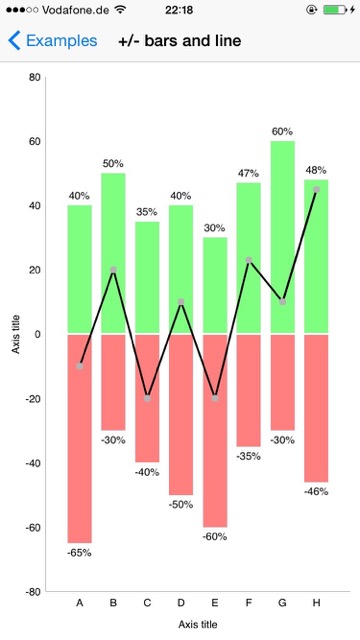
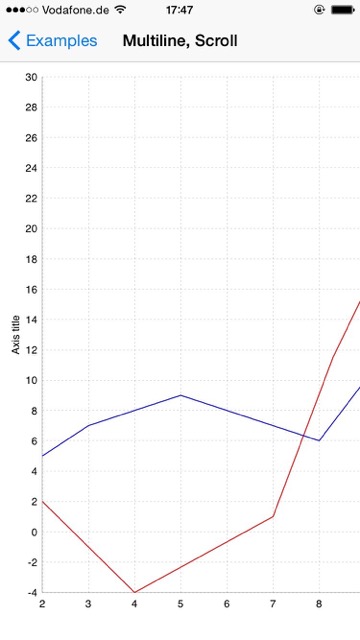
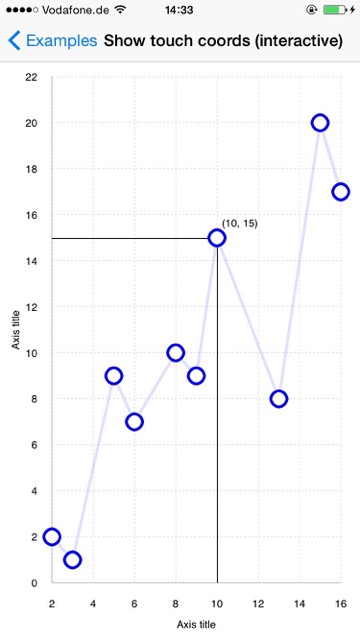
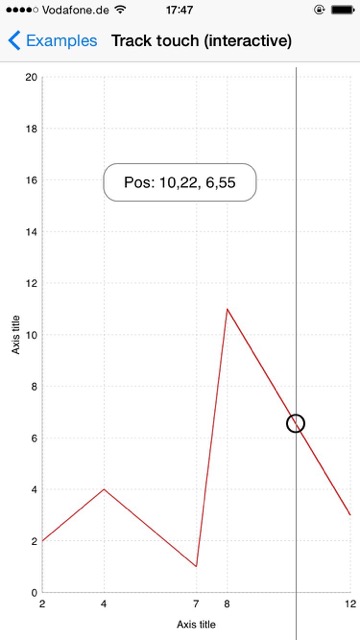
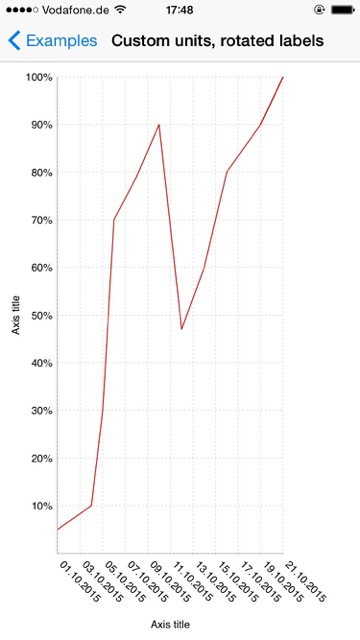
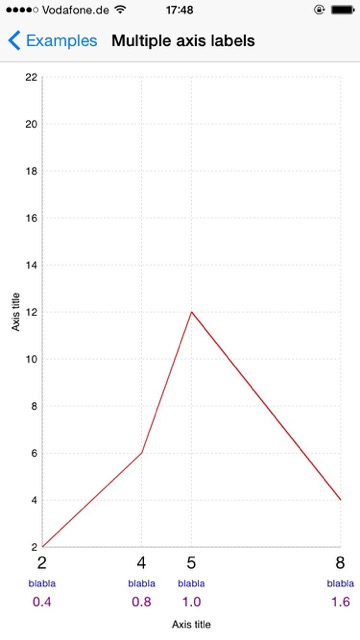
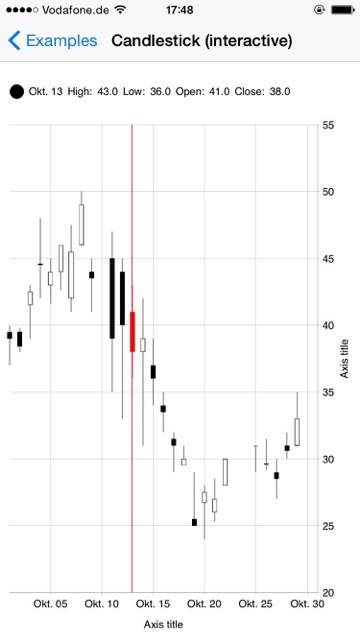
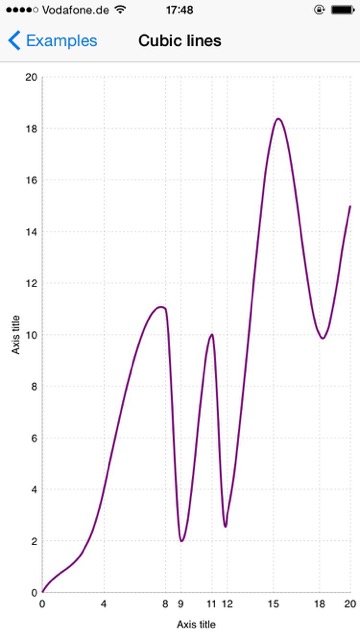
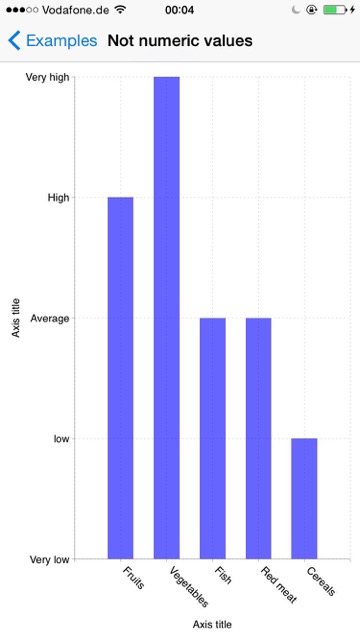
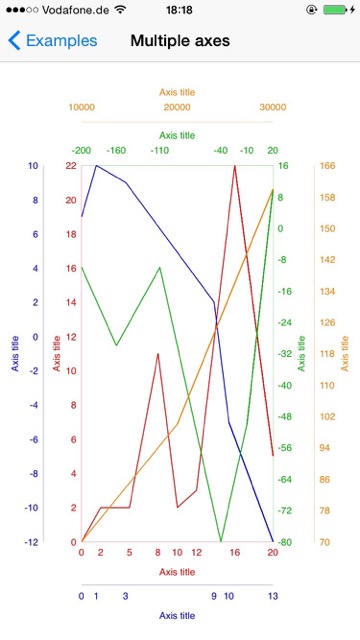
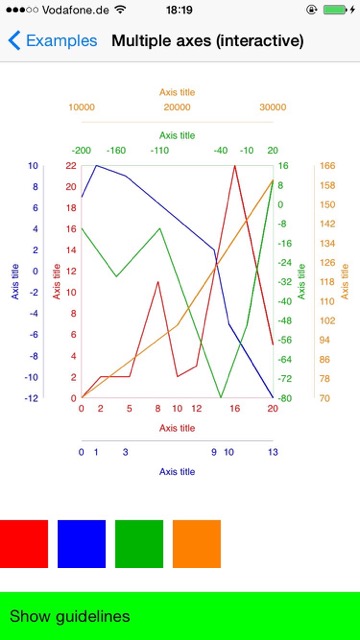
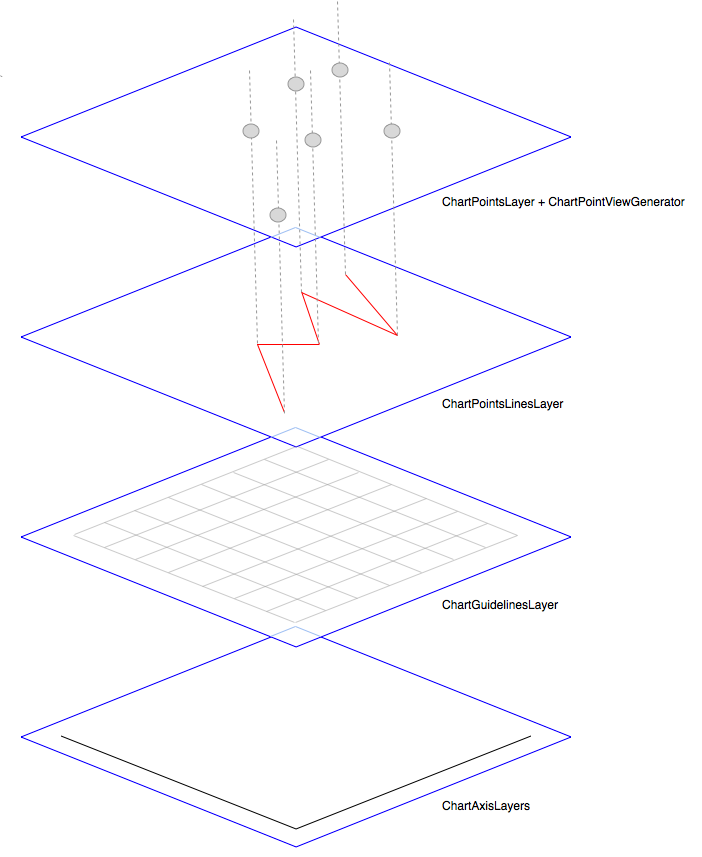
SwiftCharts Easy to use and highly customizable charts library for iOS Features: Bars - plain, stacked, grouped, horizontal, vertical Scatter Line / Multiple lines Areas Bubble Multiple axis Multiple labels (x axis) Candlestick Cubic line Everything is customizable - views (user can generate arbitrary UIViews for each chartpoint, so everything is possible), animations, units, axis, etc. Charts can be combined with each other (e.g. lines + bars + circles) Complex interactivity support Choice to use core graphics (directly on charts context) or UIViews, or combine both. Easy to use : no learning curve, no complicated settings - just assemble chart using well defined components. Swift 3.0, 2.x, 1.2, iOS 10, 9, 8, 7 Video Screenshots: Installation CocoaPods Add to your Podfile: Swift 3.0: use_frameworks! pod SwiftCharts , :git => https://github.com/i-schuetz/SwiftCharts.git Note: To use Swift 3.x / master, you need Xcode 8+ Swift 2.x: use_frameworks! pod SwiftCharts , ~> 0.4 Swift 1.2 (not actively maintained): use_frameworks! pod SwiftCharts , :git => https://github.com/i-schuetz/SwiftCharts.git , :branch => swift1.2 Alternatively: use_frameworks! pod SwiftCharts , ~> 0.2 And then: pod install Import the framework in your code: import SwiftCharts Carthage Add to your Cartfile: Swift 3.0: github "i-schuetz/SwiftCharts" ~> 0.5 Swift 2.x: github "i-schuetz/SwiftCharts" ~> 0.4 Swift 1.2: github "i-schuetz/SwiftCharts" ~> 0.2 Quick start Multiline chart: let chartConfig = ChartConfigXY ( xAxisConfig : ChartAxisConfig ( from : 2 , to : 14 , by : 2 ), yAxisConfig : ChartAxisConfig ( from : 0 , to : 14 , by : 2 ) ) let chart = LineChart ( frame : CGRectMake ( 0 , 70 , 300 , 500 ), chartConfig : chartConfig, xTitle : " X axis " , yTitle : " Y axis " , lines : [ ( chartPoints : [( 2.0 , 10.6 ), ( 4.2 , 5.1 ), ( 7.3 , 3.0 ), ( 8.1 , 5.5 ), ( 14.0 , 8.0 )], color : UIColor. redColor ()), ( chartPoints : [( 2.0 , 2.6 ), ( 4.2 , 4.1 ), ( 7.3 , 1.0 ), ( 8.1 , 11.5 ), ( 14.0 , 3.0 )], color : UIColor. blueColor ()) ] ) self . view . addSubview (chart. view ) Bars chart: let chartConfig = BarsChartConfig ( valsAxisConfig : ChartAxisConfig ( from : 0 , to : 8 , by : 2 ) ) let chart = BarsChart ( frame : CGRectMake ( 0 , 70 , 300 , 500 ), chartConfig : chartConfig, xTitle : " X axis " , yTitle : " Y axis " , bars : [ ( " A " , 2 ), ( " B " , 4.5 ), ( " C " , 3 ), ( " D " , 5.4 ), ( " E " , 6.8 ), ( " F " , 0.5 ) ], color : UIColor. redColor (), barWidth : 20 ) self . view . addSubview (chart. view ) self . chart = chart Concept: Layer architecture, which makes it extremely easy to customize charts, create new types, combine existing ones and add interactive elements. Creation of views via a generator function, which makes it easy to use custom views in any layer. Main Components: 1. Layers: A chart is the result of composing layers together. Everything is a layer - axis, guidelines, dividers, line, circles, etc. The idea is to have losely coupled components that can be easily changed and combined. This is for example the structure of a basic chart, which shows a line with circles: Following a more low level example, to provide an insight into the layer system. Note that most examples are written like this, in order to provider maximal flexibility. let chartPoints : [ChartPoint] = [( 2 , 2 ), ( 4 , 4 ), ( 6 , 6 ), ( 8 , 10 ), ( 12 , 14 )]. map { ChartPoint ( x : ChartAxisValueInt ( $0 .0), y : ChartAxisValueInt ( $0 .1))} let xValues = 0 . stride ( through : 16 , by : 2 ). map { ChartAxisValueInt ( $0 )} let yValues = 0 . stride ( through : 16 , by : 2 ). map { ChartAxisValueInt ( $0 )} let labelSettings = ChartLabelSettings ( font : UIFont. systemFontOfSize ( 14 )) // create axis models with axis values and axis title let xModel = ChartAxisModel ( axisValues : xValues, axisTitleLabel : ChartAxisLabel ( text : " Axis title " , settings : labelSettings)) let yModel = ChartAxisModel ( axisValues : yValues, axisTitleLabel : ChartAxisLabel ( text : " Axis title " , settings : labelSettings. defaultVertical ())) let chartFrame = CGRectMake ( 20 , 100 , 300 , 400 ) let chartSettings = ChartSettings () chartSettings. axisStrokeWidth = 0.2 chartSettings. top = 20 chartSettings. trailing = 20 // ... let coordsSpace = ChartCoordsSpaceLeftBottomSingleAxis ( chartSettings : chartSettings, chartFrame : chartFrame, xModel : xModel, yModel : yModel) let (xAxis, yAxis, innerFrame) = (coordsSpace. xAxis , coordsSpace. yAxis , coordsSpace. chartInnerFrame ) // create layer with line let lineModel = ChartLineModel ( chartPoints : chartPoints, lineColor : UIColor ( red : 0.4 , green : 0.4 , blue : 1 , alpha : 0.2 ), lineWidth : 3 , animDuration : 0.7 , animDelay : 0 ) let chartPointsLineLayer = ChartPointsLineLayer ( xAxis : xAxis, yAxis : yAxis, innerFrame : innerFrame, lineModels : [lineModel]) // creates custom view for each chartpoint let myCustomViewGenerator = {( chartPointModel : ChartPointLayerModel, layer : ChartPointsLayer, chart : Chart) -> UIView ? in let center = chartPointModel. screenLoc let label = UILabel ( frame : CGRectMake (center. x - 20 , center. y - 10 , 40 , 20 )) label. backgroundColor = UIColor. greenColor () label. textAlignment = NSTextAlignment. Center label. text = chartPointModel. chartPoint . description label. font = ExamplesDefaults. labelFont return label } // create layer that uses the view generator let myCustomViewLayer = ChartPointsViewsLayer ( xAxis : xAxis, yAxis : yAxis, innerFrame : innerFrame, chartPoints : chartPoints, viewGenerator : myCustomViewGenerator, displayDelay : 0 , delayBetweenItems : 0.05 ) // create layer with guidelines let settings = ChartGuideLinesDottedLayerSettings ( linesColor : UIColor. blackColor (), linesWidth : ExamplesDefaults. guidelinesWidth ) let guidelinesLayer = ChartGuideLinesDottedLayer ( xAxis : xAxis, yAxis : yAxis, innerFrame : innerFrame, settings : settings) let chart = Chart ( frame : chartFrame, layers : [ xAxis, yAxis, guidelinesLayer, chartPointsLineLayer, myCustomViewLayer ] ) self . view . addSubview (chart. view ) self . chart = chart Layers are semantic units that can add views to the chart, or can simply draw in the charts context for a better performance. Which makes more sense depends on the requirements. 2. View generators: View based layers will use a generator function to generate chart point views. This function receives the complete state of each chartpoint (model data, screen location) and produces an UIView, allowing any type of customization. Hello world: Theres a hello world included in the examples, similar to the above code, with a bit more explanations. Change some properties of the generated views, copy paste the chartPointsLineLayer used in the snippet above, and pass it to the charts layers, to display a line behind the views, and you have already mastered the main concepts! Important! Dont forget to always keep a strong reference to the chart instance or it will be released, which leads to axis & labels not showing. If you have a lot of axis labels in your chart it may be necessary to do the calculation of the coordinate space in the background, to avoid possible delays which are noticeable during transitions or scrolling. See ScrollExample or MultipleAxesExample example for this. More documentation coming soon! Contributing Fork Commit changes to a branch in your fork Push your code and make a pull request Created By: Ivan Schütz License SwiftCharts is Copyright (c) 2015 Ivan Schütz and released as open source under the attached Apache 2.0 license . THE SOFTWARE IS PROVIDED "AS IS", WITHOUT WARRANTY OF ANY KIND, EXPRESS OR IMPLIED, INCLUDING BUT NOT LIMITED TO THE WARRANTIES OF MERCHANTABILITY, FITNESS FOR A PARTICULAR PURPOSE AND NONINFRINGEMENT. IN NO EVENT SHALL THE AUTHORS BE LIABLE FOR ANY CLAIM, DAMAGES OR OTHER LIABILITY, WHETHER IN AN ACTION OF CONTRACT, TORT OR OTHERWISE, ARISING FROM, OUT OF OR IN CONNECTION WITH THE SOFTWARE OR THE USE OR OTHER DEALINGS IN THE SOFTWARE. This is a port to Swift and (massively improved) continuation of an obj-c project which I did while working at eGym GmbH https://github.com/egymgmbh/ios-charts
Easy to use and highly customizable charts library for iOS
3997
来源:
Licence:
联系:
分类:
平台:
环境:
大小:
更新:
标签:
免费下载
×


温馨提示
请用电脑打开本网页,即可以免费获取你想要的了。